
Difficulty
Moderate
Steps
6
Time Required

User-Contributed Guide
This guide is not managed by the site's staff.
Quiz
0
Introduction
Learn how to insert chart in google docs.
-
-
After inserted the chart in the spreadsheet, click the down arrow.
-
Click "Save image" to save the chart in your computer.
-
If you don't know how to insert your chart in google sheet, visit <How to Create a Chart>
-
-
-
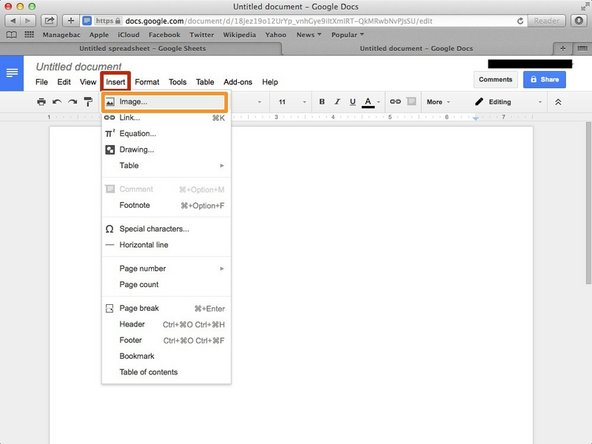
Click this icon.
-
Click the search box
-
Type the name of the image (chart) in the Orange box.
-
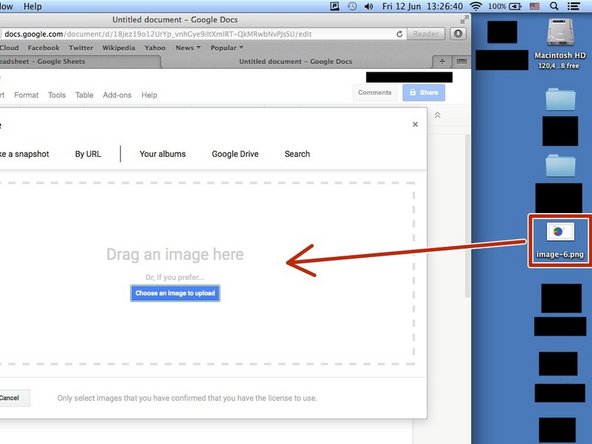
Drag the file to your desktop.
-
It makes your work easier and faster.
-
-
-
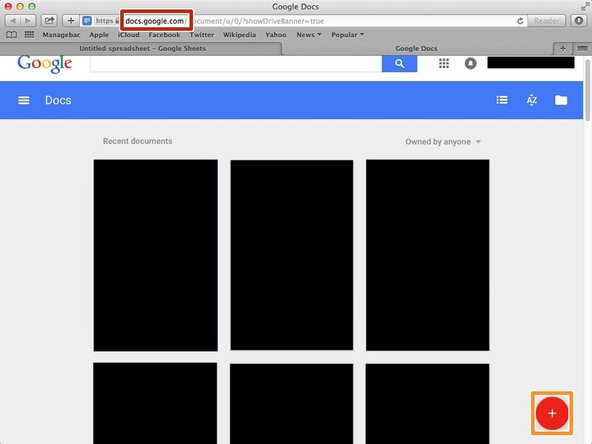
Visit <http://docs.google.com/>
-
Click "+" button to create a new document.
-
If you don't know how to log in google account, visit <How to Access the Google Docs>
-
-
-
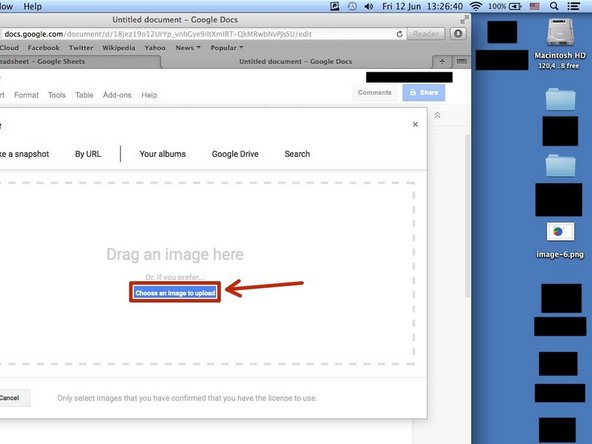
Click the blue box(it said "Choose an image to upload") and choose a image from your folder.
-

2 Comments
This website provided good information. https://bbcnewstech.com/how-to-use-googl...
usmanitzone - Resolved on Release Reply
Good website. Nice post .<a href="https://bbcnewstech.com/how-to-use-googl...>Google Sheets To Make A Graph</a>
usmanitzone - Resolved on Release Reply