Difficulty
Moderate
Steps
23
Time Required
00:15:00
- How to Create New Spreadsheet in Google Sheet 6 steps
- How to Create a Chart 17 steps

User-Contributed Guide
This guide is not managed by the site's staff.
Quiz
0
Introduction
Learn how to create a chart in Google Sheet.
-
-
Typing "google.com" in the address bar to go to the google website
-
-
-
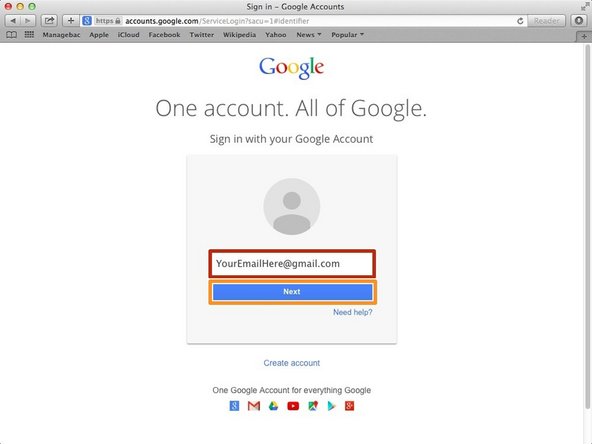
Type your email address into this box
-
Click on the blue "Next" button
-
-
-
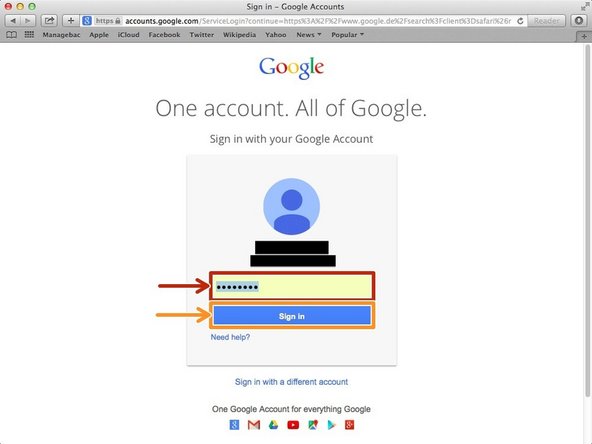
Type your password into this box
-
Click on the blue "Sign In" button
-
-
-
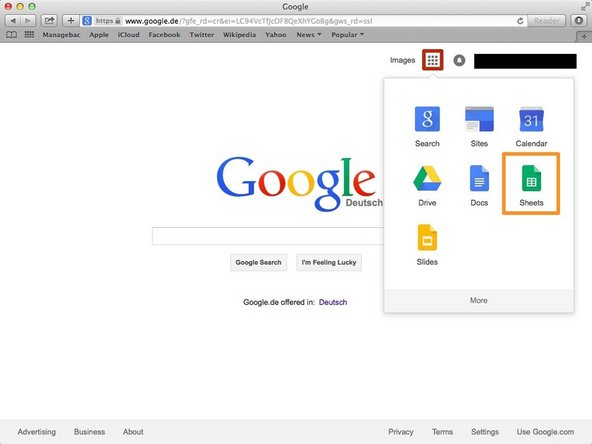
Click this button to open a menu of options
-
Click on the "Sheet" button
-
-
-
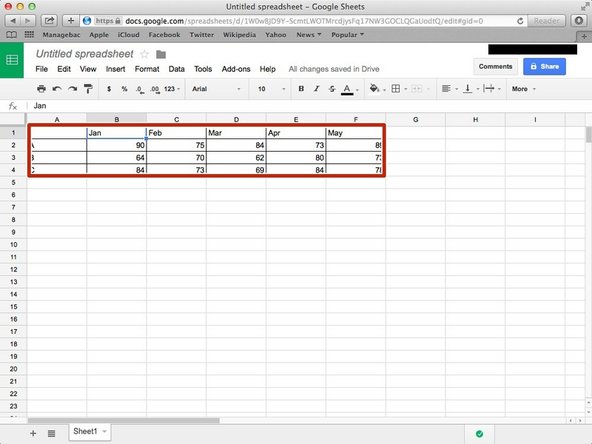
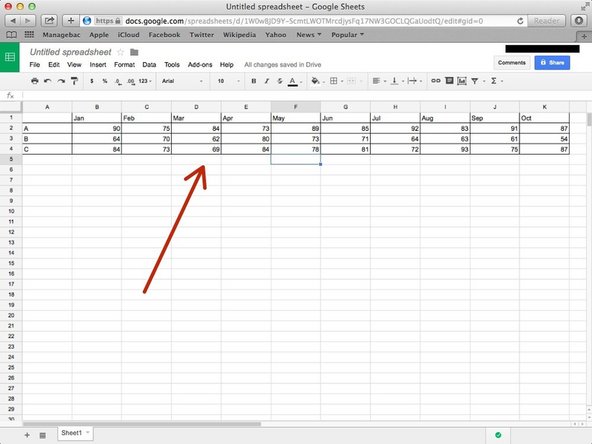
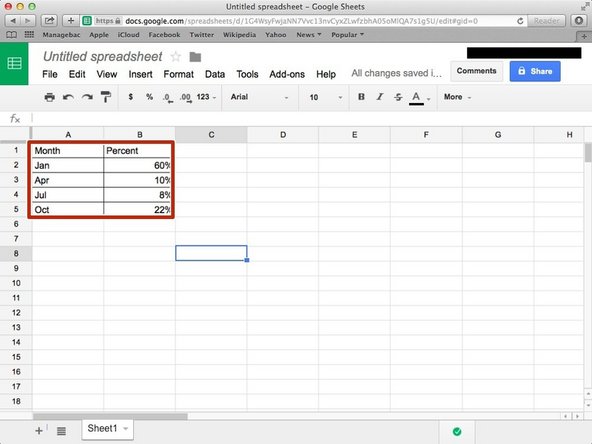
Click a box, and then type information you want to use.
-
You should put the name of the variable on the very left column and very top row.
-
-
-
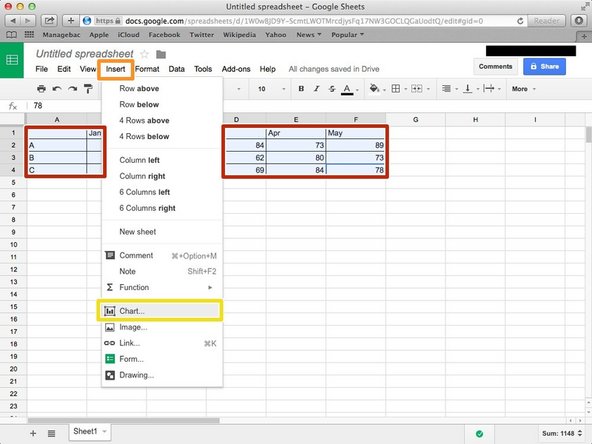
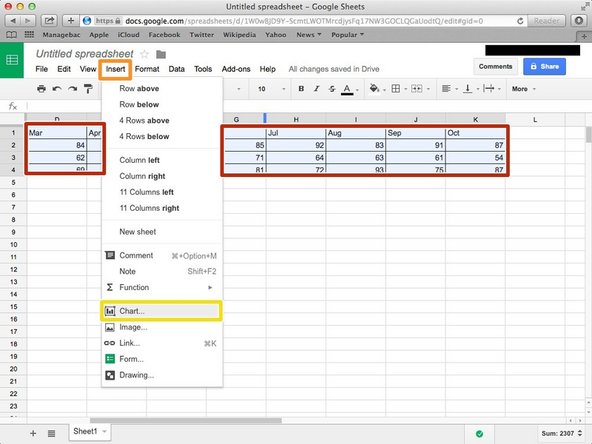
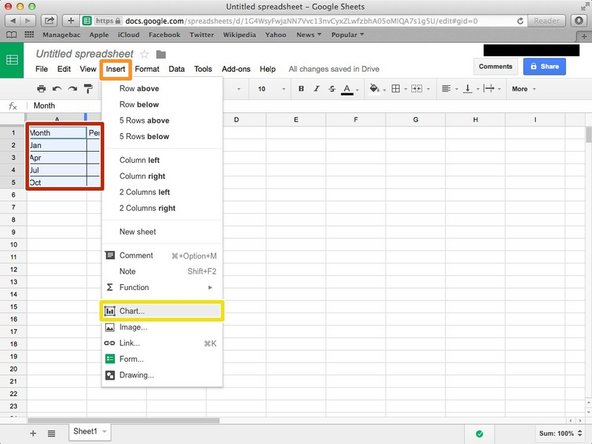
Select the table by click and drag the cursor.
-
Click "Insert"
-
Click "Chart..."
-
-
-
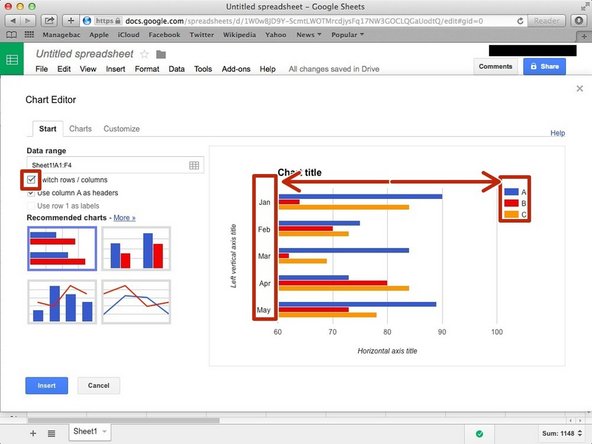
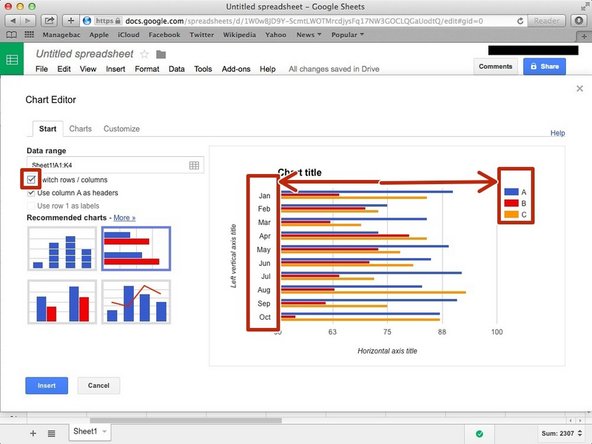
Click the box on the very left side ("Switch rows/columns") if you want to change.
-
-
-
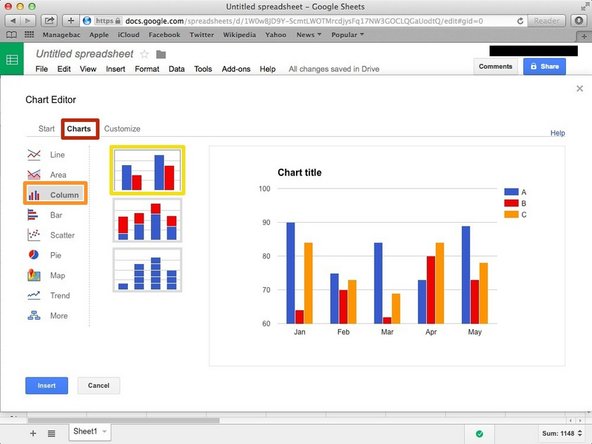
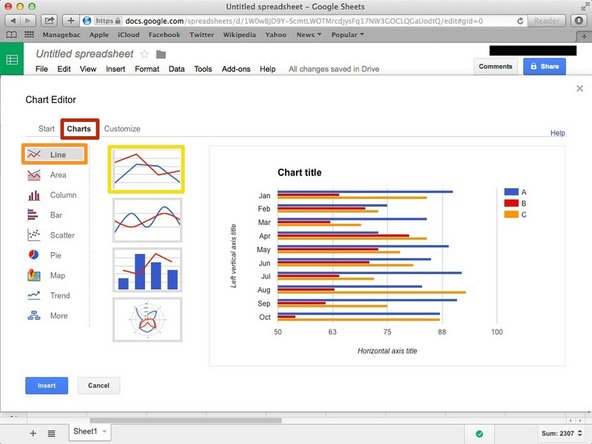
Click "Charts"
-
Click "Column"
-
Click this chart if you want to make the chart horizontally.
-
-
-
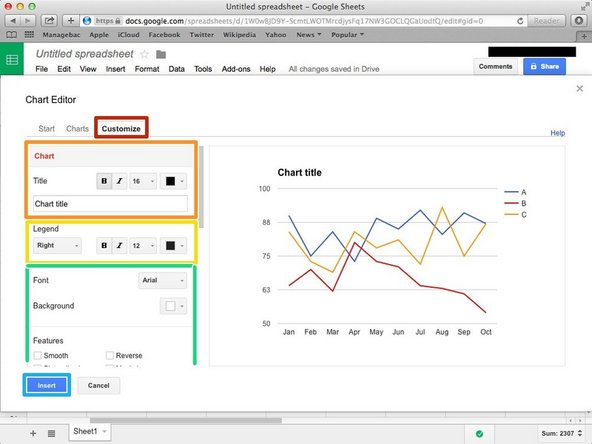
Click "Customise"
-
You can edit the Title here.
-
You can edit the Legend here.
-
If you scroll down, you can edit the 'Axis', 'Series'.
-
Click "Insert" then you can insert the chart in your spreadsheet.
-
-
-
Select the table by click and drag the cursor.
-
Click "Insert"
-
Click "Chart..."
-
-
-
Click the box on the very left side ("Switch rows/columns") if you want to change.
-
-
-
Click "Charts"
-
Click "Line"
-
Click this chart if you want to make basic line chart.
-
-
-
Click "Customise"
-
You can edit the Title here.
-
You can edit the Legend here.
-
If you scroll down, you can edit the 'Axis', 'Series'.
-
Click "Insert" then you can insert it in your spreadsheet.
-
-
-
Select the table by click and drag the cursor.
-
Click "Insert"
-
Click "Chart..."
-
-
-
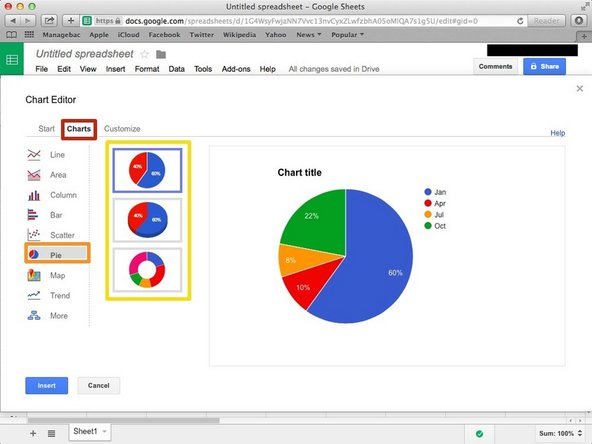
Click "Chart"
-
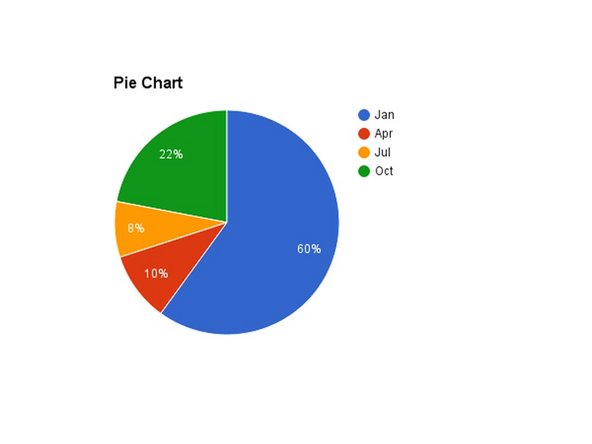
Click "Pie"
-
You can choose any type of pie here.
-
-
-
Click "Customise"
-
You can edit the Title here.
-
You can edit the Legend here.
-
If you scroll down, you can edit the circle, and 'Series'.
-
Click "Insert" then you can insert the chart in your spreadsheet.
-