
Difficulty
Moderate
Steps
14
Time Required

In Progress
This guide is currently being written. Reload periodically to see the latest changes.

User-Contributed Guide
This guide is not managed by the site's staff.
Quiz
0
Introduction
Learn how to be creative when representing data!
-
-
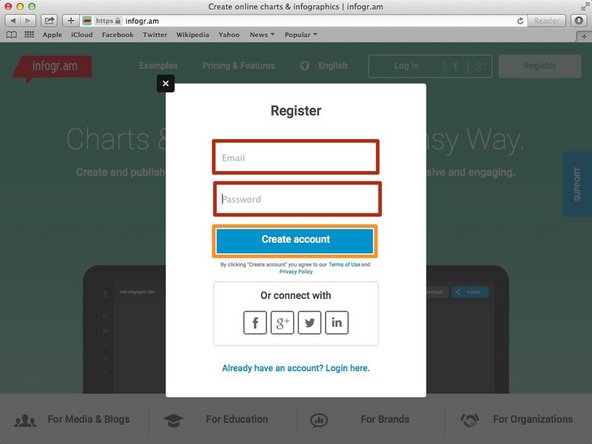
Enter your email address and your desired password into the two boxes
-
Click "create account" once the required fields have been filled out
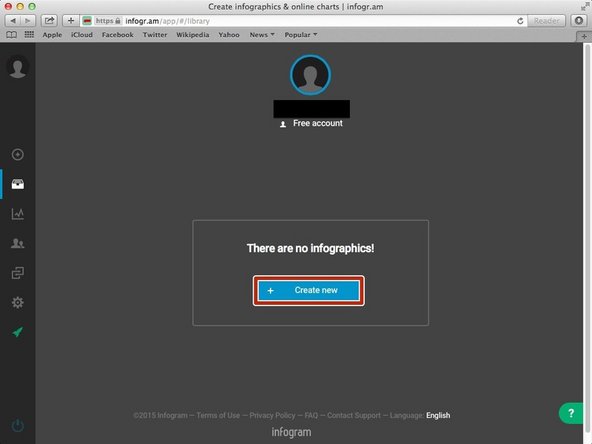
-
-
-
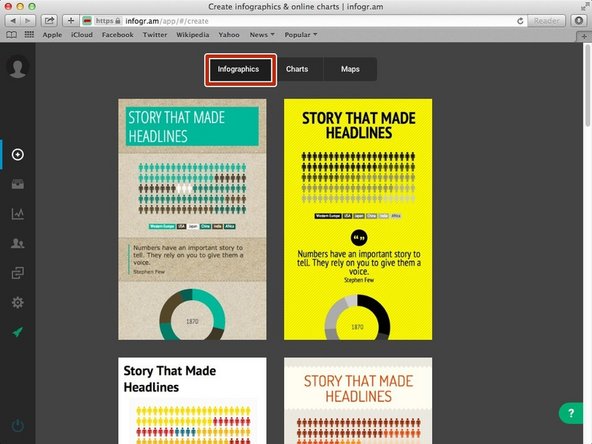
Make sure "infographics" at the top is highlighted
-
Select which style you would like to use
-
-
-
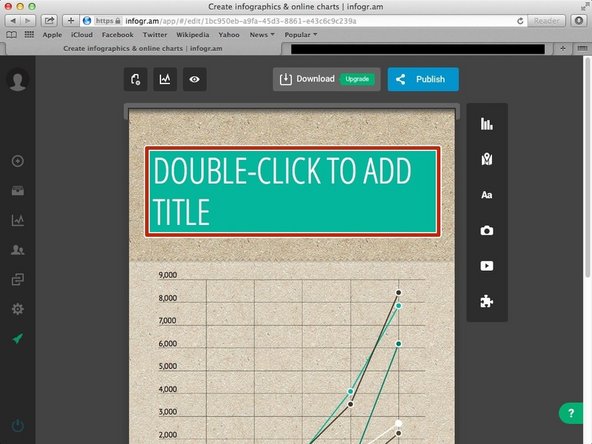
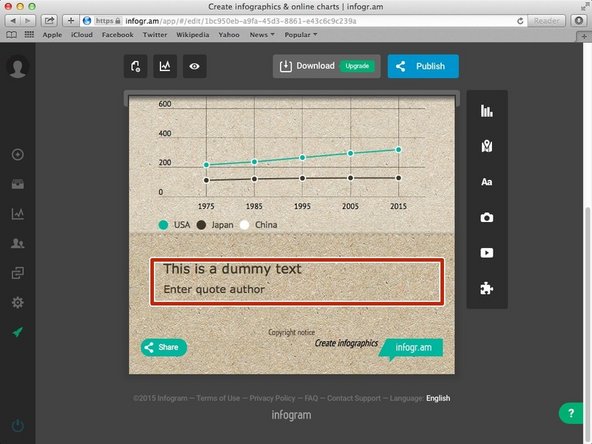
Double click in the green field to add a Title to the info graphic. An example title could be "population by country).
-
-
-
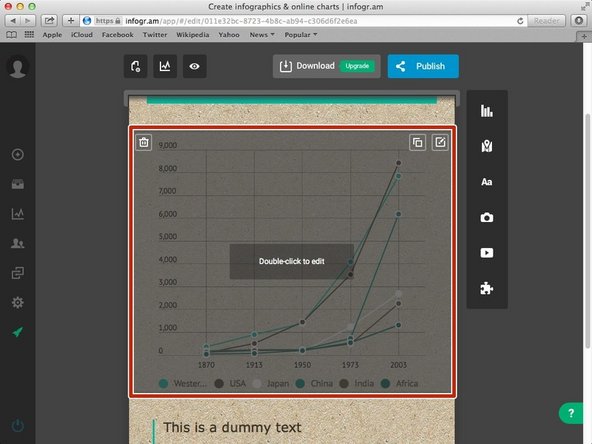
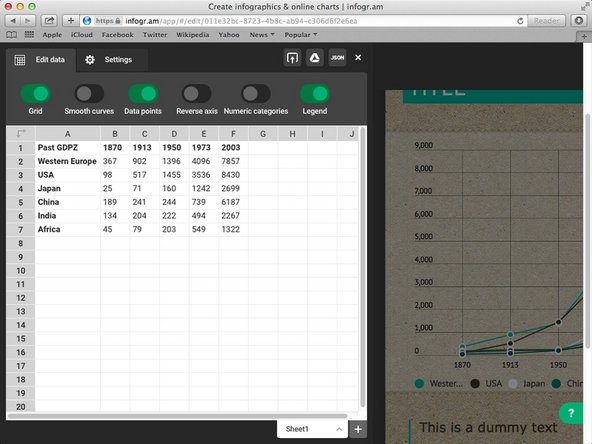
To change any of the existing numbers/labels on the axis, double click on any of the boxes.
-
-
-
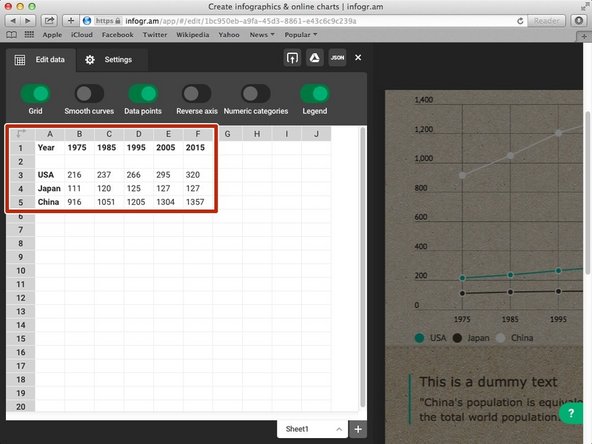
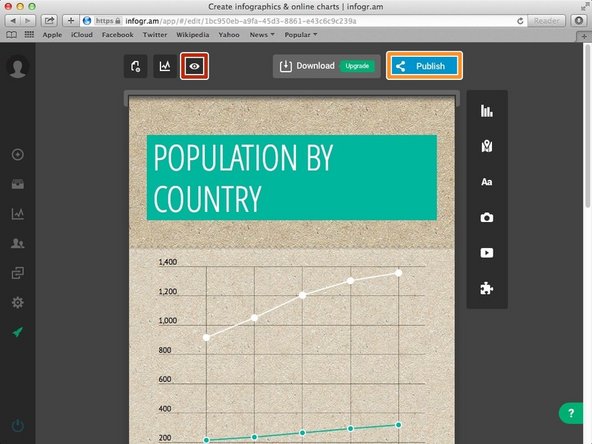
An example of a filled out sheet. It shows the population from 1975 to 2015 of the United States, China, and Japan.
-
-
-
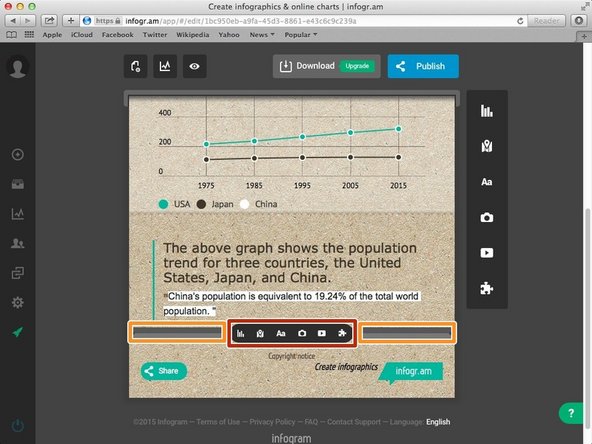
To reveal more options, hover your mouse over the highlighted orange areas
-
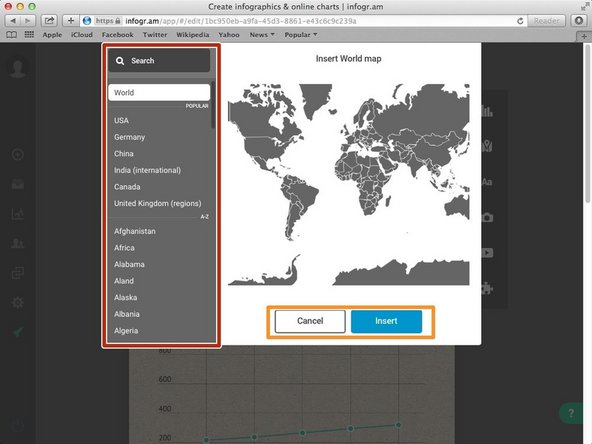
As an example, click on the second option in the row in order to add a map.
-

Cancel: I did not complete this guide.
One other person completed this guide.